


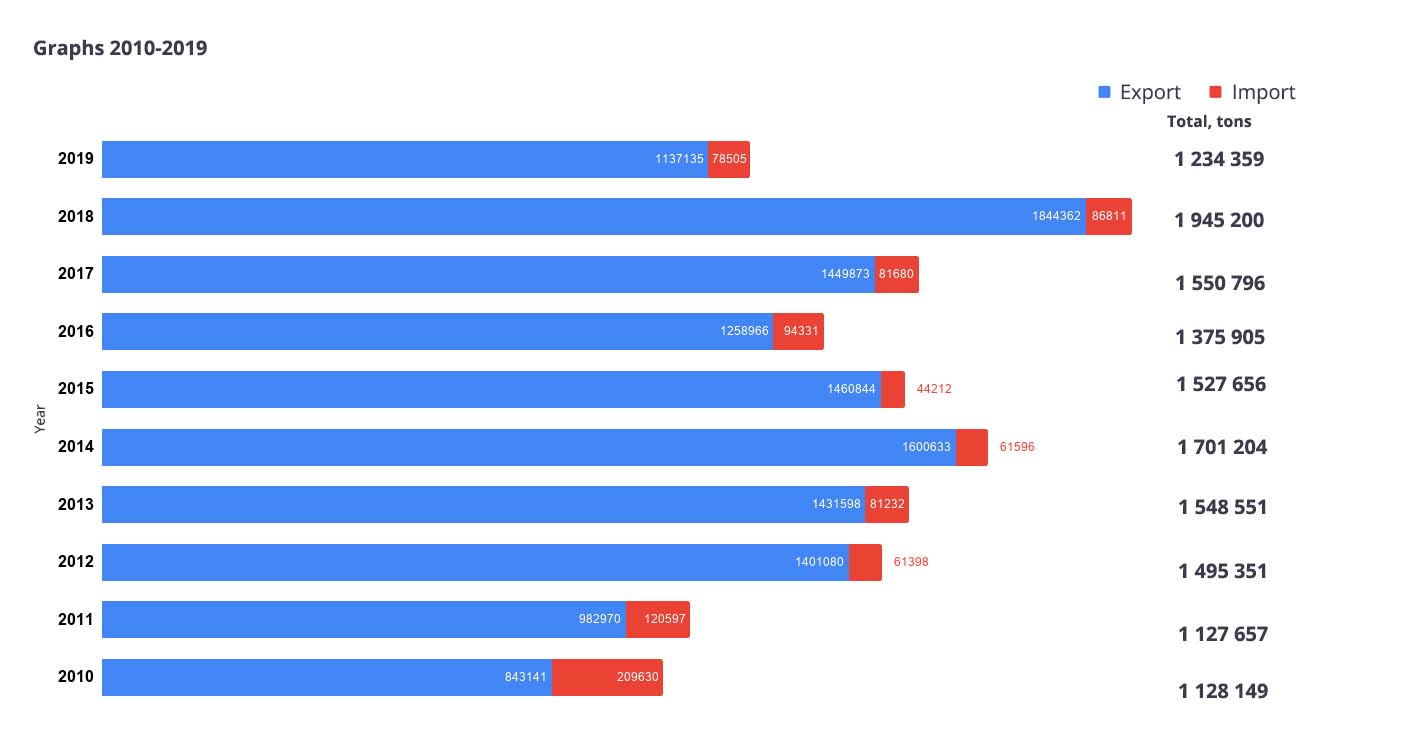
Transshipment route | 2010 | 2011 | 2012 | 2013 | 2014 | 2015 | 2016 | 2017 | 2018 | 2019 |
Export, tons | 843 141 | 982 970 | 1 401 080 | 1 431 598 | 1 600 633 | 1 460 844 | 1 258 966 | 1 449 873 | 1 844 362 | 1 137 135 |
Import, tons | 209 630 | 120 597 | 61 398 | 81 232 | 61 596 | 44 212 | 94 331 | 81 680 | 86 811 | 78 505 |
TOTAL, tons | 1 128 149 | 1 127 657 | 1 495 351 | 1 548 551 | 1 701 204 | 1 527 656 | 1 375 905 | 1 550 796 | 1 945 200 | 1 234 359 |
Number of shipcalls | 388 | 317 | 357 | 347 | 345 | 313 | 286 | 308 | 366 | 242 |
Freight cars Turnover | 16 333 | 13 375 | 15 775 | 16 906 | 19 618 | 18 413 | 16 783 | 17 910 | 25 768 | 15 625 |
Cargo | 2010 | 2011 | 2012 | 2013 | 2014 | 2015 | 2016 | 2017 | 2018 | 2019 |
Coal export | 24 434 | 84 075 | 350 116 | 531 760 | 588 209 | 482 056 | 565 191 | 671 861 | 1 206 710 | 594 613 |
Coke export | 44 208 | 49 425 | 19 529 | 23 041 | 33 090 | 54 736 | 5 520 | 9 160 | 3 910 | 24 786 |
Fertilizers in big bags | 15 344 | 42 505 | 20 813 | 18 513 | 38 083 | 66 266 | 57 637 | 6 632 | 55 068 | 47 150 |
Pellets | 0 | 0 | 325 766 | 170 559 | 253 430 | 163 754 | 55 113 | 198 550 | 10 802 | 0 |
Pellets in big bags | 17 703 | 128 769 | 0 | 0 | 0 | 0 | 6 065 | 2 667 | 0 | 0 |
Iron-ore concentrate | 0 | 0 | 0 | 0 | 0 | 0 | 0 | 0 | 0 | 21 161 |
Lignosulphonate | 50 527 | 52 514 | 50 828 | 49 327 | 29 677 | 0 | 8 585 | 3 660 | 14 656 | 3 057 |
Fertilizers (bulk) | 544 916 | 488 257 | 542 970 | 560 488 | 576 478 | 556 949 | 467 302 | 466 256 | 477 612 | 388 622 |
Baled Pulp | 44 269 | 51 378 | 42 378 | 48 937 | 25 702 | 37 729 | 47 138 | 48 851 | 49 875 | 48 066 |
Molasses | 0 | 0 | 0 | 0 | 0 | 0 | 0 | 0 | 0 | 0 |
Machinery | 41 | 0 | 0 | 0 | 0 | 0 | 0 |
| 0 | 0 |
Oil | 5 101 | 11 140 | 0 | 0 | 0 | 0 | 0 | 0 | 0 | 0 |
Sawn wood | 9 149 | 14 320 | 1 809 | 5 577 | 0 | 0 | 0 |
| 0 | 0 |
Roundwood | 0 | 0 | 0 | 0 | 36 747 | 72 610 | 37 701 | 26 261 | 10 715 | 3 150 |
Containers | 0 | 0 | 0 | 0 |
| 0 | 0 | 334 | 0 | 0 |
Cast Iron | 17 189 | 15 826 | 10 119 | 0 | 0 | 0 | 0 | 0 | 0 | 0 |
Pipes | 9 363 | 2 947 | 5 486 | 0 | 0 | 0 | 0 | 0 | 0 | 81 |
Hard Coal/Anthracite | 0 | 0 | 0 |
| 1 526 | 2 089 | 0 | 0 | 0 | 0 |
Rails | 9 500 | 0 | 0 | 0 | 0 | 0 | 0 | 0 | 0 | 0 |
Linen Seeds | 0 | 0 | 0 | 0 | 0 | 0 | 0 | 0 | 2 850 | 0 |
Slabs |
| 9 824 |
|
|
|
|
|
| 0 | 0 |
Magnesite in big bags | 36 795 | 14 102 |
|
|
|
|
|
| 0 | 0 |
Machinery in boxes | 0 | 0 | 0 | 0 | 0 | 0 | 0 | 0 | 0 | 249 |
Scrap metal, slags | 14 602 | 17 888 | 31 266 | 23 396 | 17 691 | 24 655 |
|
| 12 164 | 6 200 |
TOTAL EXPORT | 843 141 | 982 970 | 1 401 080 | 1 431 598 | 1 600 633 | 1 460 844 | 1 258 966 | 1 449 873 | 1 844 362 | 1 137 135 |
Coal import |
| 3 462 |
|
|
| 1 650 | 44 520 | 36 861 | 44 527 | 41 741 |
Titanium ore (slag) |
|
|
|
|
|
|
|
|
| 11 049 |
Coke import | 13 292 | 16 596 | 11 439 | 6 862 | 7 103 |
|
|
|
|
|
Chrome iron ore, import |
|
|
|
|
|
|
|
| 5 500 |
|
Automotive Equipment |
|
|
|
|
|
|
|
|
|
|
Anorthosite import |
|
|
| 6 003 | 7 445 |
|
|
|
|
|
Containers | 48 |
|
|
|
|
|
|
|
|
|
Mineral Raw Materials import |
|
|
|
|
| 0 | 0 | 2 518 | 6 371 | 2 000 |
Aluminium Hydroxide import | 3 819 | 39 372 | 16 634 | 22 318 | 15 534 | 20 884 | 31 409 | 26 059 | 13 883 | 4 971 |
Ferrosilicon Manganese import |
|
| 15 007 | 13 538 | 2 997 | 2 260 | 1 300 | 0 | 0 |
|
Boxites import |
|
|
| 2 198 | 2 207 | 0 | 0 | 0 | 0 |
|
Wine-making materials | 36 507 | 12 521 |
|
|
|
|
|
|
|
|
Machinery | 16 960 | 13 278 |
|
|
|
|
|
|
|
|
Other imported cargo (spar in packages) | 17 374 | 15 661 | 18 318 | 30 313 | 24 981 | 19 418 | 17 102 | 16 242 | 16 530 | 18 744 |
Baled Pulp (import) |
| 1 523 |
|
|
|
|
|
|
|
|
Soybean meal | 45 333 | 6 038 |
|
|
|
|
|
|
|
|
Steel import | 76 297 | 12 146 |
|
| 1 329 |
|
|
|
|
|
TOTAL IMPORT | 209 630 | 120 597 | 61 398 | 81 232 | 61 596 | 44 212 | 94 331 | 81 680 | 86 811 | 78 505 |
Machinery – coastal shipping |
|
|
|
|
|
|
| 150 |
|
|
Gravel, plates – coastal shipping | 47 896 |
|
|
|
|
|
|
|
|
|
TOTAL | 1 100 667 | 1 103 567 | 1 462 478 | 1 512 830 | 1 662 229 | 1 505 056 | 1 353 297 | 1 531 703 | 1 931 173 | 1 215 640 |
Local cargo | 27 482 | 24 090 | 32 873 | 35 721 | 38 975 | 22 600 | 22 608 | 19 093 | 14 027 | 18 719 |
TOTAL | 1 128 149 | 1 127 657 | 1 495 351 | 1 548 551 | 1 701 204 | 1 527 656 | 1 375 905 | 1 550 796 | 1 945 200 | 1 234 359 |